



We manage an irrigation canal network that delivers water to farmland. During irrigation season the growers at the head of the canal and the growers at the tail both need water at the same time — and the only tool we had for deciding how much water went where was a staff gauge read by hand, once or twice a day.
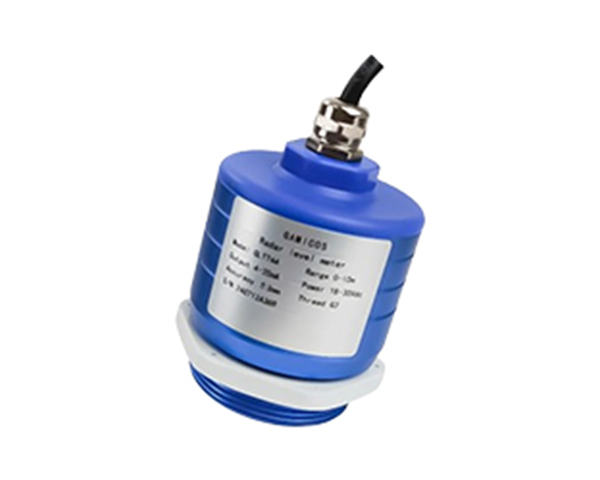
The difficulty was never really the instrument. It was that we were making distribution decisions without knowing how the level was actually moving. Putting the GLT744 80GHz radar level meter on every monitored cross-section, and getting continuous level data from all of them at once, is what changed how we schedule water.
HARTConnects to the RTU already installed at each cross-section — no architecture change
Project Background: An Irrigation Network Run on One Reading a Day
The customer is a Korean organisation responsible for agricultural irrigation water delivery and distribution scheduling, and its problem started long before any sensor was involved — it started with how water is allocated across the canal.
The network the operator is responsible for
The network carries irrigation water from its source down a main canal and out through a series of branch canals to the farmland at the tail end. Each branch canal draws its water through an offtake regulated by a gate, and every one of those diversion points is controlled by a gate setting — which depends entirely on what the water level in the main canal is doing at that moment. The network is large enough that no single person can watch more than one part of it at a time, and long enough that travelling between the far cross-sections takes a meaningful part of a working day.
Why canal level is the control variable for irrigation
Canal level is not a number the operator simply watches. It is the variable they act on. Level determines how much water flows into each branch canal, which determines whether the fields at the tail end of the system get their share or whether the head-end sections take more than they need. During the irrigation season, water is moving through the whole network at once, and every gate adjustment made upstream shows up as a level change downstream. Run the canal too low and the tail-end fields never receive water; run it too high and there is an overtopping risk and avoidable stress on the lining. Underneath all of that sit two questions the operator has to answer every season: how much water was actually delivered, and how much was lost in conveyance along the way?
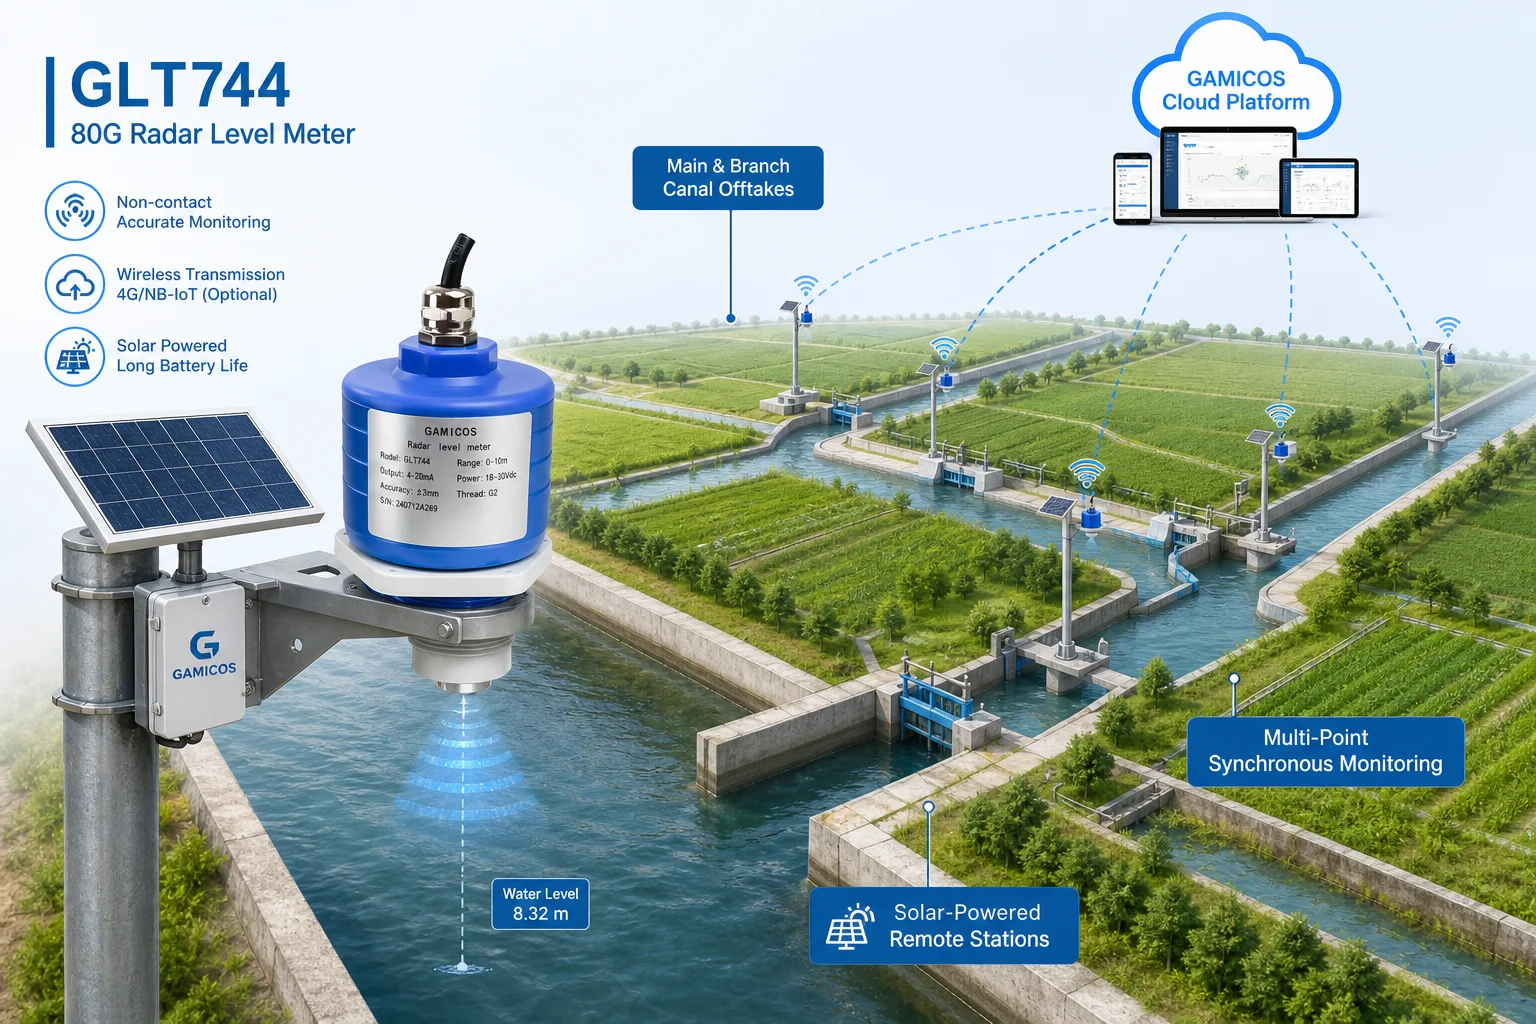
Figure 1: Multi-Point Synchronous Canal Level Monitoring Architecture
The canal itself is a lined concrete channel, and its cross-sections are, by design, crowded with hard structures — lining walls on both banks, gate frames and measuring weirs. That detail matters later, when it comes to mounting instruments on a canal that already exists.
The operational constraints at the sites
Most monitoring cross-sections have no mains electricity and no convenient network connection, and they are spread out along the length of the canal. Anything installed on the canal has to run from its own power supply, transmit its data remotely, and be cheap enough to operate that the operator can afford to instrument more than one or two points. Those three constraints together rule out a large part of the instrumentation that would otherwise be considered.
Why the level data actually mattered
Irrigation here is concentrated into the summer growing season, which means the whole year's demand for reliability lands in a few months. Before this project, canal level was taken by hand at each cross-section and recorded on paper. What the operator needed was not a better single reading — it was continuous level data, from several cross-sections at the same time, in a form that could support a distribution decision. That is precisely what they did not have.
The Pain Points: Four Failures in Irrigation Water Management
The operator did not set out to replace an instrument — they set out to stop making distribution decisions blind. All four of the problems below come down to the same missing input.
1. Distribution decisions were made on a snapshot, never on a trend
SymptomLevel was captured once or twice a day, at whatever time a member of staff could get to the gauge. The trend between those visits — whether the canal was still rising, already falling, or holding steady — was simply unknown.
Root causeThe measurement was a physical visit, so it could only ever produce a value at the moment of the visit. A gate adjustment made at nine in the morning and the level response it produced an hour later both fell into the gap between readings.
ConsequenceGate settings were decided on the last known value rather than on what the canal was doing now. Peak-season delivery depended on staff being able to reach each gauge in turn, and the effort still produced data too sparse to schedule from.
2. Water struggled to reach the tail end, and nobody saw it happening
SymptomFields downstream of the network were the first to run short, while growers at the head end rarely reported any shortage at all.
Root causeHead-end and tail-end cross-sections were never observed at the same time. An over-supply at the head of the canal only became visible days later, when it reappeared as a shortfall far downstream — by which point the water was already gone.
ConsequenceDistribution was inequitable in practice even when it was fair on paper, complaints concentrated at the tail end of the system, and a meaningful share of the delivered water was never used productively.
3. There was no traceable record when an allocation question came up
SymptomLevel data existed only as handwritten logbook entries, with gaps and no curve.
Root causeNothing in the setup collected or stored a continuous time series. A number written in a book is a single point; it carries no information about duration, rate of change or trend.
ConsequenceWhen a grower disputed how much water their branch canal had received, or when the operator needed to report delivered volumes against an allocation, there was no record that could settle the question. Season-to-season comparison of distribution performance was impossible.
4. Conveyance loss could not be measured, so it could not be reduced
SymptomThe operator knew water was being lost between the source and the tail end of the network, but could not put a number on how much or say where it was happening.
Root causeConveyance loss is the difference between what goes in upstream and what arrives downstream, so it can only be worked out from simultaneous measurements at more than one cross-section. With readings taken one place at a time, on different days, no such comparison was possible.
ConsequenceCanal lining and maintenance investment could not be targeted at the sections that were actually leaking, and there was no way to demonstrate the effect of any improvement that was made.
All four problems come back to one missing input: continuous level data across the canal, from more than one place at the same time. Every one of them is a question about how the level changes over time, or about how two cross-sections compare right now — and a staff gauge read by hand can only ever answer "what is the level, right here, right now." That is why the project did not start from a list of instrument features. It started from one requirement: measure continuously, at every cross-section that matters, and bring the data back to one place.
What the Customer Required from a Replacement
Working back from those four pain points, the operator set six requirements for any replacement instrument. They apply to almost any irrigation canal level monitoring project.
- Continuous automatic measurement — the level has to be captured without anyone visiting the site, at whatever interval the scheduling decision needs.
- Accuracy good enough to account with — the reading must support water allocation and water accounting, not just indicate roughly how full the canal is.
- One instrument type for the whole network — the same model must cover shallow branch canals and the deep main canal, so the operator is not stocking and maintaining two different setups.
- Low operating cost per cross-section — because the value of the system scales with how many cross-sections are instrumented, the per-site maintenance burden has to be near zero.
- Standard industrial interfaces — must connect into the existing RTU / data acquisition system at each site without changing the architecture the operator already runs.
- Field-commissionable and self-powered — canal cross-sections have no mains power and nothing convenient to plug into, so installation, commissioning and verification must be doable on site from a mobile device.
The Product: GLT744, and How It Maps onto Each Pain Point
The GLT744 is a non-contact radar level meter built on 80 GHz FMCW (frequency-modulated continuous wave) technology. Its value in this project is not a list of specifications — it is that each of the operator's four problems is answered by a specific property of the instrument.
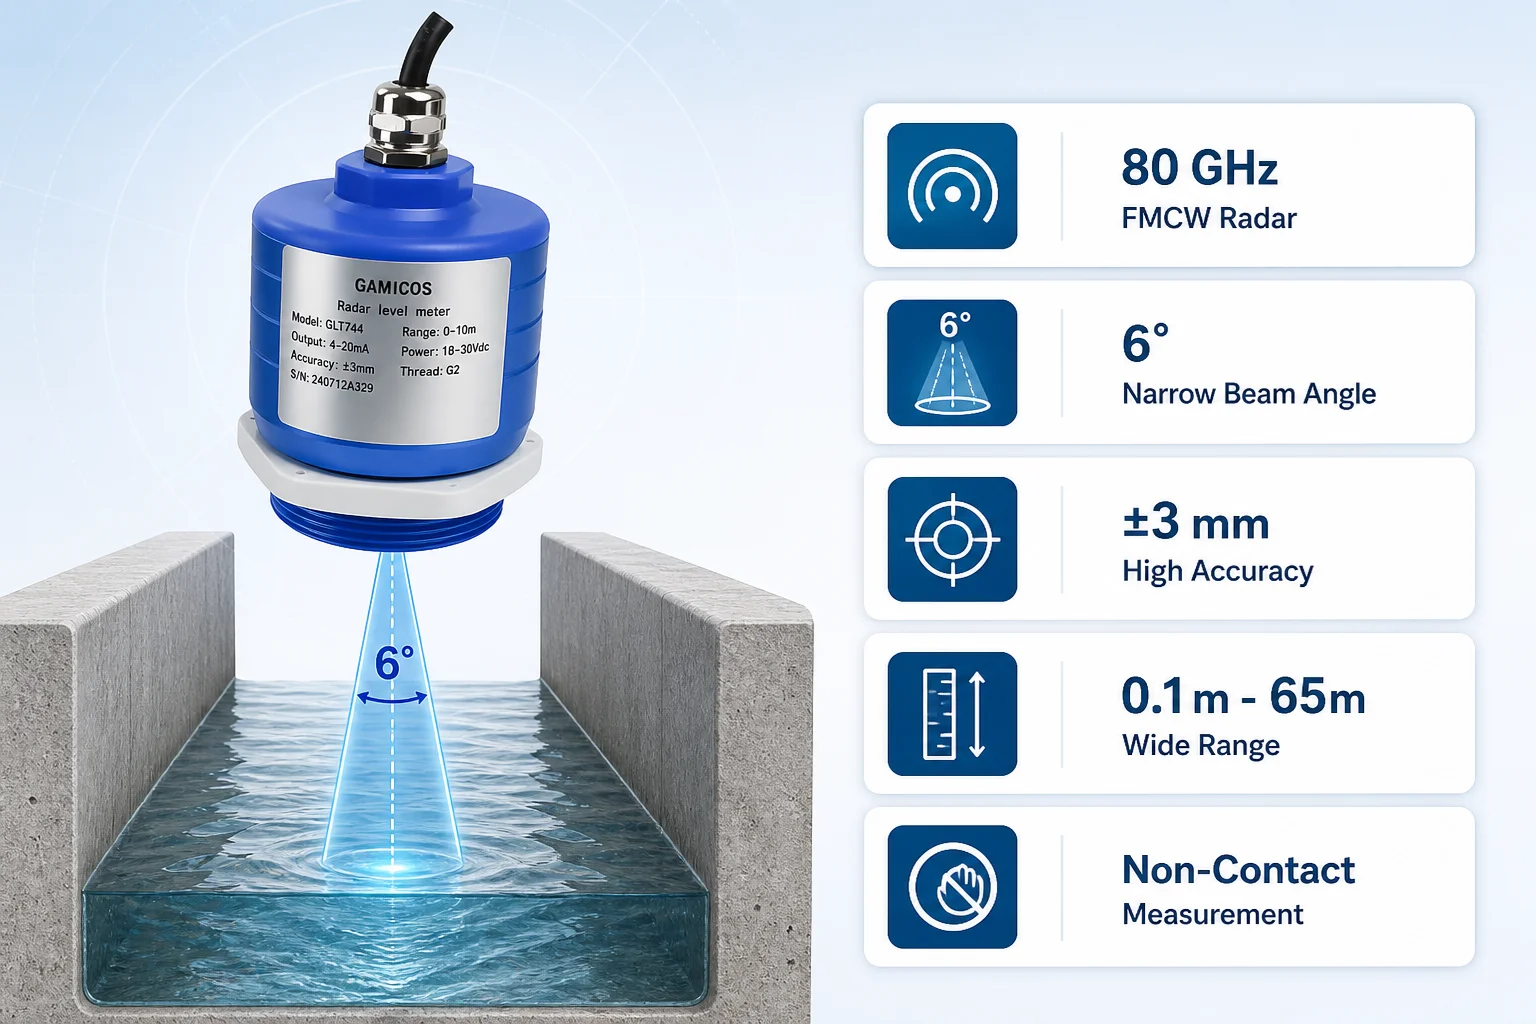
Figure 2: GLT744 80GHz FMCW Radar 6° Beam Angle & Key Technical Specifications
Pain point to solution, at a glance
| Pain point | Why it happened | What the GLT744 does | What changed on the canal |
|---|---|---|---|
| Distribution decided on a snapshot | Level was read by hand, so a reading only existed when someone visited the site | Measures continuously and outputs the value electronically over 4-20mA / RS485 / HART | The operator sees the trend and the rate of change, not just the last known value |
| Tail-end shortfall going unnoticed | Head-end and tail-end cross-sections were never observed at the same time | The same instrument at every monitored cross-section, all reporting into one platform | Head and tail levels can be compared at the same moment, so over-supply is visible when it happens |
| No traceable record for allocation questions | Nothing collected or stored a continuous time series | ±3 mm measurement, feeding the existing RTU and from there the monitoring platform | Water delivery becomes a traceable record that can support allocation and reporting |
| Conveyance loss unmeasurable | Loss can only be derived from simultaneous data at more than one cross-section | Continuous level at multiple cross-sections, synchronised on one platform | Loss moves from a rough estimate to a calculation, and can be attributed to specific canal sections |
The engineering behind the fix
The mapping above is the commercial case. The technical reasons each of those properties holds up on a working canal are worth stating on their own — particularly because this project only works if the operator can instrument several cross-sections, not one.
Non-contact radar — what makes a multi-section network affordable to run
The GLT744 measures level from above the water surface with nothing in the water, which is what makes it practical to instrument many cross-sections rather than one. A monitoring network is only useful if several points report at once, and the operating cost of that network is dominated by how often someone has to visit each site. With no wetted parts and no periodic cleaning or replacement cycle, the ongoing work per cross-section drops to occasional verification rather than routine servicing. That is the difference between a system the operator can justify at one location and one they can justify along the length of a canal.
±3 mm accuracy — the grade at which level data becomes account-grade data
The GLT744 measures to ±3 mm, which is the threshold at which a level reading stops being an indicator and becomes a measurement you can allocate and account with. For irrigation water management this is the difference between a number that starts a disagreement about delivered volume and a number that settles one. The 0.1–65 m measuring range also matters at network scale: the same instrument covers the shallow branch canals and the deep main canal, so the field team works from a single setup procedure and the operator stocks a single spare.
A 6° beam angle — installs into the canal that already exists
The GLT744 transmits at 76–81 GHz with a 6° beam angle, and in the confined geometry of a canal that narrow beam is a functional advantage rather than a specification detail. A canal cross-section is full of hard, reflective structures — lining walls on both banks, sluice gate frames, measuring weirs — and the narrower the beam, the smaller the chance of picking up a false echo from a side wall or a gate frame, and the more tolerance there is in mounting position and angle. In practice this means cross-sections can be instrumented by mounting on the structures already present, without civil works. Ultrasonic level meters typically use a much wider beam and are also affected by temperature and humidity in their propagation speed; for a canal, radar is the more predictable choice.
4-20mA, HART, RS485 and Bluetooth — dropping into a system that already exists
The GLT744 offers 4-20mA, HART, RS485 and Bluetooth communication, and connects directly into the customer's existing RTU or data acquisition system. No part of the operator's architecture had to be rebuilt: each cross-section needed only one additional analogue input channel or one additional RS485 port on the RTU already in service. Keeping the existing acquisition layer intact was a deliberate risk decision — it kept each site's retrofit small, the commissioning familiar, and the failure modes already understood by the operations team. Because the pattern repeats identically at every cross-section, adding the next monitoring point costs far less effort than the first one did.
14–28 VDC and solar power — because canal sites have no mains electricity
The GLT744 runs on a wide 14–28 VDC supply, which allows it to operate from a solar panel and battery at cross-sections with no mains power. This is not a convenience feature in a canal network — it is what makes the majority of monitoring points installable at all. A small solar system at each location is enough for continuous operation; the exact configuration depends on local solar conditions and the instrument's power consumption.
Bluetooth commissioning — quick to set up, quick to verify, site after site
The GLT744 has a built-in Bluetooth module supporting wireless connection and debugging, so commissioning and data reading on site can be done from a mobile device. A technician stands at the canal edge and checks the live reading against the calibrated value from a phone: no laptop to carry down the bank, and no need to open the wiring compartment. Given that the operator's staff are already travelling between distant cross-sections, this shortens both first commissioning and every later verification visit — which matters most in a network where the same operation has to be repeated at every site.
Results After Installation: What Changed in Irrigation Water Management
Once the GLT744 units were installed and commissioned across the monitored cross-sections, the change showed up in five places — and each of them traces back to the same shift: canal level stopped being something the operator went out to look at, and became something the operator continuously has.
1. Monitoring became continuous instead of incidental — without adding inspection rounds
Before, the level existed as one or two values a day, captured whenever staff could reach a gauge. After installation, every instrumented cross-section reports on the configured interval, around the clock, through the whole irrigation season. The operator gained continuous coverage without adding a single inspection round — the routine site visits that used to produce the data are now only needed to verify the instrument itself.
2. Distribution decisions moved from a snapshot to a trend
This is the change the operations team noticed first. A single reading tells you what the level is; a continuous curve tells you what it is doing — rising, falling, or holding — and how fast. Gate adjustments can now be decided against the direction and rate of change of the level rather than against the last value someone happened to record. The gap between a gate change upstream and its effect downstream became something the operator can see rather than something they wait to be told about hours later.
3. Head-end and tail-end can now be compared at the same moment
Because every instrumented cross-section reports into one platform on the same time base, the operator can now look at the head of a branch canal and its tail end at the same instant. Over-supply at the head end stopped being invisible until it reappeared as a downstream shortfall days later — it is now visible as a divergence between two curves while there is still time to act on it. This is the change that most directly addresses the distribution fairness problem that complaints had been pointing at for years.
4. Water delivery became accountable
With ±3 mm radar accuracy feeding the existing RTU and, from there, the monitoring platform, the operator now holds a continuous level record for each monitored cross-section rather than a series of isolated handwritten entries. Questions about how much water a branch canal received can now be answered from a traceable dataset rather than from recollection. The same record supports reporting delivered volumes against allocation, and makes season-to-season comparison of distribution performance possible for the first time.
5. Conveyance loss moved from an estimate to a calculation
Conveyance loss is the difference between what enters the canal upstream and what arrives downstream, so it can only be derived from simultaneous measurements at more than one cross-section — which is exactly what the retrofit made available. Loss between two monitored points is now a computable quantity rather than a figure the operator could only describe as "significant." That changes where maintenance and lining investment gets directed, and it gives the operator a way to show whether an intervention actually worked.
Before and after: the two measurement regimes compared
The table below compares what each approach is capable of, rather than quoting one site's measurements. Product performance figures come from the GLT744 datasheet.
| Dimension | Before — manual / staff gauge | After installation — GLT744 |
|---|---|---|
| Measurement method | A physical visit to each cross-section; one value per visit | Continuous automatic measurement; electronic output |
| Data collection interval | One or two values per day, whenever a visit can be made | At the configured interval, continuously, including outside working hours |
| Level accuracy | Depends on the observer and the gauge graduation | ±3 mm (datasheet) |
| Cross-sections observed at the same time | One, at the moment it is visited | All monitored cross-sections, on one shared time base |
| Basis for allocation decisions | The last reading someone recorded | Current trend and rate of change across sections |
| Water accounting and reporting | Handwritten entries with gaps and no curve | Continuous, traceable level records |
| Conveyance loss | Not derivable from single-point readings | Derivable between monitored cross-sections |
| Inspection workload | Every reading requires a site visit | Visits are for instrument verification only |
| Response to a level change | Known only at the next visit | Visible as soon as new data arrives |
Note: the comparison rows describe the capability of the two measurement methods, not one operator's measured results; the only numeric figure on this page is the ±3 mm instrument accuracy taken from the GLT744 datasheet.
What This Means for the Operator, in Practice
Stepping back from the individual changes: the operator moved from managing distribution on a set of isolated observations to managing it on a continuously updated picture of the canal. Gate decisions can now be checked against what the water actually did afterwards, the monitored branch canals each have a level record standing behind their delivered volume, and the sections losing the most water are the ones the data points at.
None of that required changing the canal. It required changing how the canal's level is measured.
Where Else This Approach Applies
The GLT744's non-contact radar principle suits any application that needs continuous water or liquid level data at a cost that makes more than one measuring point affordable.
- Irrigation water management — continuous level monitoring along main and branch canals, supporting water allocation, distribution scheduling and conveyance loss analysis.
- Water resource management — level monitoring for reservoirs, rivers and lakes.
- Urban drainage — real-time level monitoring in drainage networks and channels, giving flood control scheduling a factual basis.
- Industrial applications — level control and monitoring in chemical, oil and mining storage tanks.
Frequently Asked Questions
- How does continuous canal level monitoring actually improve irrigation water allocation?
- It replaces a snapshot with a trend. With manual reading, a gate setting is decided on the last value someone recorded, and the level response to that adjustment is unknown until the next visit. With continuous measurement on several cross-sections at once, the operator can see the direction and rate of change at the head end and the tail end simultaneously, so distribution decisions can be made on what the canal is doing rather than on what it was doing several hours ago.
- Do we need one instrument per cross-section, or can one cover the whole canal?
- Conveyance loss and distribution fairness both require more than one measuring point, because they are derived from the difference between an upstream and a downstream cross-section. In practice a network usually starts with the head of each branch canal plus one or more points at the tail end. The GLT744's 0.1–65 m range means the same model covers both the shallow branch canals and the deep main canal, so the instrument type does not change as the network grows.
- How is conveyance loss calculated from level data?
- Conveyance loss is the difference between the volume entering the canal upstream and the volume arriving downstream, so it needs simultaneous measurements at two or more cross-sections. The GLT744 measures level, not flow directly. Where a stage-discharge rating curve already exists for a cross-section, the measured level can be converted to flow through that curve, and the difference between sections gives the loss over that reach. Where no rating curve exists, the level data still makes the loss traceable as a level difference and highlights which reaches are behaving abnormally.
- Can the GLT744 connect to our existing RTU or SCADA system?
- Yes. The GLT744 provides 4-20mA, HART and RS485 wired communication plus Bluetooth wireless connection. A cross-section that already has an RTU or SCADA system usually needs only one additional analogue input channel or one additional RS485 port — no change to the existing system architecture. This keeps the first retrofit small and makes each following cross-section faster to commission than the last.
- There is no mains electricity at the canal site. How is the instrument powered?
- The GLT744 runs on a wide 14–28 VDC supply, which makes it suitable for a solar panel and battery installation. A small solar power system at a cross-section without mains power is enough for continuous operation; the exact configuration depends on local solar conditions and the instrument's power consumption.
- What should we consider when choosing monitoring cross-sections and mounting points?
- Choose cross-sections with steady, non-turbulent flow and no eddies or backflow, clear of the disturbance caused by gate operation, and mount the instrument with the antenna face vertical and parallel to the water surface. For distribution management, the siting decision matters as much as the instrument: place points at the head of each branch canal and at the points furthest downstream that need to be defended. After mounting, calibrate the empty distance — the distance from the antenna face to the canal bed — as the reference for level conversion. The GLT744 supports both bracket and threaded mounting, and the reading and calibration values can be verified on site over Bluetooth from a mobile device.
- What GLT744 variants are available?
- The GLT744 can be configured by housing material (cast aluminium or stainless steel), protection grade (IP65 or IP68), process connection (G2 thread or bracket), output (4-20mA + Bluetooth, 4-20mA + HART + Bluetooth, RS485, or RS485 + Bluetooth), measuring range (0-10 m, 0-30 m or 0-65 m) and cable length. The full ordering code is shown in the specification table below.
GLT744 Technical Specifications
The figures below are the standard GLT744 specifications and can be used directly for selection and system design.
| Model | GLT744 80G radar level meter (80 GHz FMCW) |
| Measuring range | 0.1 m – 65 m |
| Transmission frequency | 76 GHz – 81 GHz |
| Accuracy | ±3 mm |
| Beam angle | 6° |
| Power supply | 14 – 28 VDC |
| Communication | 4-20mA / HART / Bluetooth / RS485 |
| Operating temperature | -30 to 75 °C |
| Housing material | Stainless steel / cast aluminium |
| Antenna type | Lens antenna |
| Protection grade | IP68 |
| Installation | Bracket / thread |
| Cable entry | PG9 cable connection |
| Recommended cable size | 0.5 mm² |
| Dimensions | Body diameter 70 mm, overall height approx. 95.4 mm, G2 mounting thread |
Ordering Code
| Field | Code | Meaning |
|---|---|---|
| Housing material | P | Cast aluminium |
| F | Stainless steel | |
| Protection grade | L | IP65 |
| G | IP68 | |
| Process interface | F | G2 thread |
| B | Frame / bracket | |
| Output | 1 | 4-20mA + Bluetooth |
| 2 | 4-20mA + HART + Bluetooth | |
| 3 | RS485 | |
| 4 | RS485 + Bluetooth | |
| Range | W | 0-10 m |
| E | 0-30 m | |
| R | 0-65 m | |
| Cable length | X | Customised length (m) |
| Measured medium | L | Liquid |
Are You Scheduling Irrigation Water Without Knowing the Level?
If your canal network faces the same problems this operator did — distribution decided from a reading taken hours ago, tail-end sections running short before anyone notices, no traceable record when an allocation question comes up, and conveyance loss that can only be described as "significant" — the approach in this case study transfers directly.
- Send us your site conditions (canal cross-section, level range, number of monitoring points, power availability, existing acquisition system) and we will recommend a configuration
- Range, output, mounting method and cable length are configurable to the project
- Installation and on-site Bluetooth commissioning support is available, including multi-site rollout
Xi'an Gavin Electronic Technology Co., Ltd (GaMicos)
Tel: +86 029-81292510 Email: info@gamicos.com Web: www.gamicos.com